Description
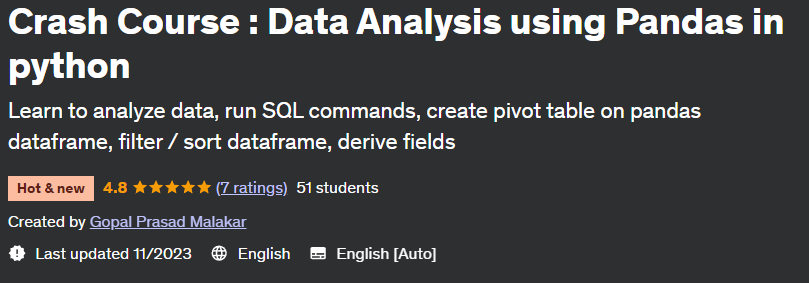
Crash Course: Data Analysis using Pandas in Python. This course will follow the following structure
Part 1: Getting Started with Python
- This section explains how to install the Aanconda distribution and write the first code
- Additionally, walking on the Spyder platform
Part 2: Work on the data
- P02 01A Running SQL in Python
- P02 01 Understanding data n Add comments in code
- P02 02 Know the contents of the data
- P02 03A Missing Value Diagnosis n Treatment Part 1
- P02 03B Introduction to Jupyter IDE
- P02 03C Missing numerical value with average n date missing value treatment
- P02 03D Create a copy of a dataframe n drop a record based on the missing value of a specific field
- P02 03E Replace missing value with median or mode
- P02 04 Data filtering n keeping multiple columns in the data
- P02 05 Use iloc to filter data
- P02 06 Numeric variable analysis with group by n Transfer results
- P02 07 Number of frequency distribution n percent including missing percent
- P02 08 An introduction to the substring n function
Part 3: Working on multiple datasets
- P03 01 Create Dataframe in execution Append concatenate dataframe
- P03 02 Integration of DataFrames
- P03 03 Remove full or column duplicates Sort data frame Keep first last max min
- P03 04 get row for maximum value of each column in easy way n then via idxmax
- P03 05 Use idxmax iterrows forloop to solve a complex question
- P03 06 Create derived fields using numeric fields
- P03 07 Cross Tab Analysis n Place the result in another data transfer result
- P03 08 variable extraction based on character field
- P03 09 variable extraction based on the date field
- P03 10 The first day of the last day of the same day of the last n months
Section 4: Data visualization and some commonly used terminology
- P04 01 n-bar histogram chart in Jupyter and Spyder
- P04 02 Line chart Pie chart Box chart
- P04 03 Review of some thin Python software
- P04 04 Scope A global scope local scope variable
- P04 05 Range Object
- P04 06 Casting or conversion variable type n cutting thread
- P04 07 lambda function n drop columns from pandas dataframe
Section 5: Some statistical methods and other advanced cases
- P05 01 Simple diagnosis of outliers n treatment
- P05 02 Creating a report in Excel format
- P05 03 Create pivot table in pandas data frame
- P05 04 Renaming the columns of a dataframe
- P05 05 Read write attached data in SQLlite database
- P05 06 Write code execution report
- P05 07 Linear regression using Python
- P05 08 Chi-square test of independence
What you will learn in Crash Course: Data Analysis using Pandas in python
-
Quickly start using Python to analyze data with Pandas
-
Learning how to use SQL with Pandas Dataframe
-
Learn data operations like merge, sort, concatenate
-
Learn by watching practice examples
-
Teaching how to create a histogram, box chart, pie chart, bar chart, line chart
-
Learning how to interact with the SQLlite database from Python
-
Learn linear regression, chi-square test of independence, outlier detection, and more.
This course is suitable for people who
- Anyone interested in using Python for data analysis
- Professional data analysis
- People who want to migrate from other platforms like SAS to Python
- data scientist
Details of the Crash Course: Data Analysis using Pandas in Python
- Publisher: Udemy
- teacher: Gopal Prasad Malakar
- Training level: beginner to advanced
- Training duration: 4 hours and 10 minutes
- Number of courses: 41
Headlines of Crash Course: Data Analysis using Pandas in Python
Crash Course prerequisites: Data Analysis using Pandas in python
- The course will train everything from scratch and in a simplified manner for data analysis purposes
- The course is less about Python programming and more about using different packages for data analysis purposes.
Course images
Sample video of the course
Installation guide
After Extract, view with your favorite Player.
Subtitle: None
Quality: 1080p
download link
File(s) password: www.downloadly.ir
Size
3.16 GB
