Description
Data Science & Python course – Maths, models, Stats PLUS Case Study. Data science and Python course – Mathematical models of statistics plus case studies. What you will learn:
- Introduce the concept of data and information
- Identify the difference between business intelligence and data science
- Understanding and learning the data science process
- Defining the demands and challenges for people working in data science
- Identify the difference between the discussion of dispersion and descriptive and inferential statistics
- Learn to follow the steps after installing Anaconda
- Learn to expand the data discussion and interquartile range
- Define the advantages of obtaining conditional probability based on an example
- Identify the advantage of z-score calculation
- Learn p-value calculation and learning factors on p-value
- And…
Contents and overview
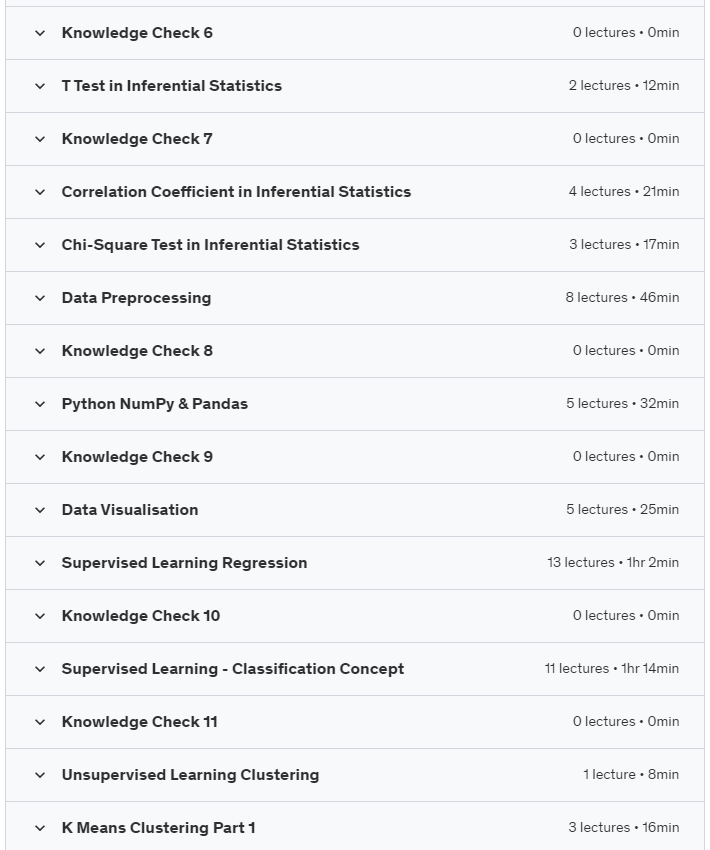
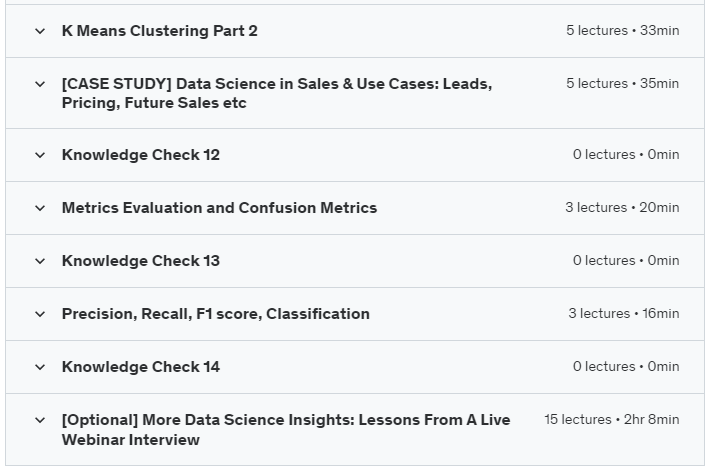
You will start with the concept of data and information. The difference between business intelligence and data science; Business intelligence vs. data science based on parameters factors. Prerequisites and questions of a data scientist; Questions about applying as a data scientist – statistics and data domains. Prerequisites for business intelligence and discussion of data science tools. types of data acquisition; Data preparation, exploration and its agents; data science process; Know the career aspects of a data scientist. Demand and challenges for data science. Discussing mathematical and statistical concepts and examples; Discuss variables – numerical and categorical. Discussion about qualitative variables and central tendency. Dispersion discussion and descriptive versus inferential statistics. descriptive and inferential statistics; Descriptive statistics, examples and installation steps of Anaconda. Steps to follow after installing Anaconda. Using Jupyter in Anaconda. How to use the Jupyter program; Continuing the use, explanation and discussion of Jupiter; Getting data and putting data into Jupyter. Minimizing data for viewing in Jupyter and importing data from Excel. Explanation of modes used in Jupyter program in statistics and data analysis. Variables – continuous and categorical variables. Entering and typing data in the Jupyter program. Get average data in Jupyter based on example. How to summarize median and mean data, enter quantity data and explain factors. Expanding the data discussion and interquartile range. Interquartile range and input data; Mean deviation of the variance in the mean. Variance calculation; Discuss the degrees of freedom based on variables and calculation. An introduction to possibilities and an overview of the lesson. Obtaining the conditional probability based on the example. Continuing the example based on the students’ data on probability. Create a new column for absences and a column for the pivot table. Calculate and encode the probability result of students’ bet. We will also cover inferential statistics. Probability distribution and density. Gaussian distribution; Defining distribution parameters and drawing a normal distribution diagram. PDF and CDF – Cumulative distribution function. Learn what correlation coefficient, Z-score and Z-test are. Calculating Z-scores What do Z-scores tell you? Z test and find the percentage under the curve. Get the mean, get the data, hypothesize and compare the mean. Average comparison and variable discussion. Continuation of the Z-test, calculation of the P-test and continuation of the steps in the Z-test. Conducting a small Z-test, statistics and discussion of factors. Null hypothesis, performing Z test, finding and defining P value, calculating P value and learning factors on P value, T test, diamond data test and corresponding mean value. How to import data sets, t-test and learning. Learn correlation coefficients, scatterplots, calculus. Obtain correlation of scatter plot data. Next, we will discuss the classification of learning and the concept of learning. Machine learning areas and important concepts; An example of a spam filter, labeled data and unlabeled data, training vs. error. Classification has a 2-step process, data preparation issues. Decision tree learning and sample problem. Learning Decision Tree Induction – training datasets and discussing examples. Doing decision tree classification in Python. Import some libraries and data, agents and templates. Continue by understanding and discussing the data; Examining the split train test and creating a classified decision tree. The solution in the tree, the tree plot also interprets the data and what is the Gini index, K stands for clustering and the algorithm. Stopping/convergence criterion with examples and K-means algorithm. Strengths and weaknesses of K meaning and discussion factors. How the K-means clustering method works and the learning factors. Combination of data processing and data reception and encryption agents. Label encryption code to use, encrypt data, using transform ; Doing clustering and using sklearn. Continued k-means clustering and other factors in Python coding. Preview data on sales and other factors and topics. Data Science Use Cases in Sales, Case Study – Forecasting Future Sales. Description of data mean standard deviation and factors. Data loading, index column removal and relationship between predictors. Sign up now and we’ll help you improve your data science skills!
What you will learn in Data Science & Python – Maths models Stats PLUS Case Study course
-
Introduce the concept of data and information
-
Identify the difference between business intelligence and data science
-
Understanding and learning the data science process
-
Define the demand and challenges for data scientists
-
Identify the difference between the discussion of dispersion and descriptive and inferential statistics
-
Learn the steps to follow after installing Anaconda
-
Learn to expand the data discussion and interquartile range
-
Define the advantages of obtaining conditional probability based on an example
-
Identify the advantage of z-score calculation and other factors
-
Learn how to calculate the p-value and learn other factors on the p-value
-
Know the prerequisites and questions of a data scientist
-
Learn the types of data acquisition
-
Know the career aspects of a data scientist
-
Discuss mathematical and statistical concepts and examples
-
Learn descriptive and inferential statistics and their factors
-
Learn how to use the Jupyter application
-
Calculation of variance and discussion of other factors
-
Get the conditional probability based on the example
-
Learn what probability distribution and density are
-
Learn the Z test and find the percentage under the curve
-
Compare mean and variable
-
Learn what the chi-square test is and discuss it based on the example data
-
Teaching data preprocessing in Python
-
Check array shape and dimensions and discussion in encoding window
-
Learn why data visualization is important and how to use it
-
Learn parametric and algorithmic methods
-
Classification of learning and the concept of learning
-
Learn K stands for Clustering and Algorithms
-
Doing clustering and using sklearn on it and encoding other factors
-
Learn TP, TN, FP and FN confusion matrix and discussion accuracy
-
Training report classification and calculation in the coding window in Python
This course is suitable for people who
- This course is for everyone interested in data science, machine learning, statistics, probabilities and business intelligence
Course specifications Data Science & Python – Maths models Stats PLUS Case Study
Course topics Data Science & Python – Maths models Stats PLUS Case Study
Data Science & Python course prerequisites – Maths models Stats PLUS Case Study
- No programming experience necessary, you will learn everything you need to know
Course images
Sample video of the course
Installation guide
After Extract, view with your favorite Player.
English subtitle
Quality: 720p
download link
File(s) password: www.downloadly.ir
Size
10.9 GB


