Description
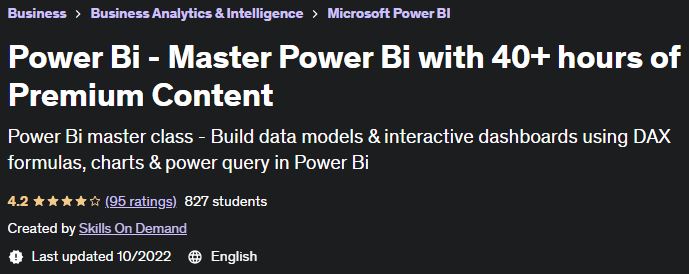
Power Bi – Master Power Bi with 40+ hours of Premium Content Power Bi – Master Power Bi training course with more than 40 hours of premium content published by Yodemy Academy.
Master Power BI Desktop and learn advanced Power BI analytics and data visualization. This course provides you with the skills to create dynamic reports and interactive dashboards to analyze and interpret meaningful insights from any of your data using business intelligence tools such as Microsoft Power BI. We have created content relevant to real-world scenarios. In this course, you will learn how to analyze data based on relationships using Power BI. Power BI is a business analytics and business intelligence service by Microsoft. It aims to provide interactive visualizations and business intelligence capabilities with a simple user interface where end users can create their own reports and dashboards. Power BI is part of the Microsoft Power Platform. Power BI is a collection of software services, applications, and interfaces that work together to transform your data from disparate sources into more immersive and insightful visual reports.
With Power BI Desktop, you can create rich and interactive reports with visual analysis for free. It can connect to more than 65 internal and cloud data sources to turn information into interactive visuals. Data scientists and developers work with Power BI Desktop to produce reports and make them available to the Power BI service.
What you will learn in the Power Bi – Master Power Bi training course with 40+ hours of Premium Content:
- We have covered 151 data modeling scenarios using Power Query, DAX and Data Visualization.
- Master Data Analysis (DAX) and Power Query (M Language) expressions for Power BI Desktop
- Learn how to analyze data from multiple sources.
- Learn about Power BI Desktop and its components. Understand the end-to-end business intelligence workflow
- How to create, convert and create relationships between different tables
- How to create a report with different interactive visualization types
- And …
Who is this course suitable for:
- Anyone interested in learning data analysis and data visualization using business intelligence tools such as Power BI.
- Are you interested in creating interactive visualizations, reports, and dashboards with Power BI Desktop?
- Learn how to turn raw data into compelling data visualizations using Power BI.
- If you are interested in storytelling based on existing data.
Course details
- Publisher: Yudmi
- teacher: Skills On Demand
- English language
- Education level: specialized
- Number of courses: 176
- Training duration: 39 hours and 32 minutes
Course headings
Course prerequisites
Willingness for learning new things and applying the learned concepts with creativity
You need to download Power BI Desktop from Microsoft website (This is a free software from Microsoft)
This course may not be for you if you have a Mac
A computer with Windows as operating system. This course is designed for PC users
Basic understanding of data analysis is an added advantage but not a requirement
Having a work or school email address to sign in to Power BI Desktop is an added advantage
Pictures

Course introduction video
Installation guide
After Extract, view with your favorite Player.
Subtitle: None
Quality: 720p
download link
Password file(s): www.downloadly.ir
Size
17.2 GB